7. Labour market discrimination
KAT.TAL.322 Advanced Course in Labour Economics
April 4, 2024
Labour market discrimination
What is discrimination?
Discrimination arises when for the same level of productive characteristics, labour market outcomes differ based on nonproductive characteristics.
Employers may discriminate in hiring/firing decisions
Co-workers may discriminate in collaboration activity
Customers may discriminate in purchase decisions
Taste discrimination
Taste discrimination
First formalized by Becker (1957)
- There are two types of workers \(A\) and \(B\)
- Workers are perfect substitutes in production function \(F(A + B)\)
\(\Rightarrow\) equally productive \(F_A(\cdot) = F_B(\cdot)\)
A firm decides which worker to employ to maximise the utility
\[ \max_{A, B} PF(A + B) - w_A A - w_B B - d B \]
where \(d \geq 0\) is the disutility employer gets from worker \(B\).
Taste discrimination
Optimal labour demand conditions
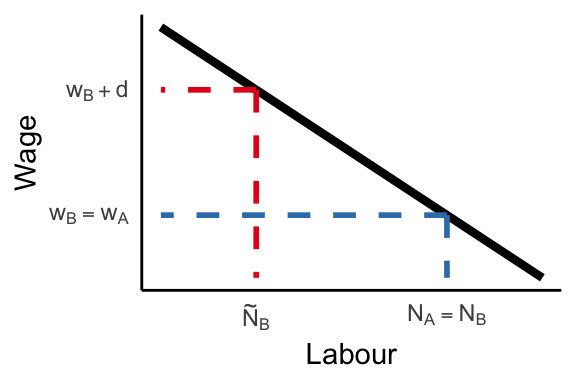
\[ \begin{align} PF_A(A + B) &= w_A \\ PF_B(A + B) &= w_B + d \end{align} \]
Discriminating firm (\(d > 0\)) hires \(B\) workers iff \(w_A > w_B + d\).
Employment of \(B\) workers is lower than competitive level.
Taste discrimination
Perfect competition and free entry
Non-discriminating firms \(d = 0\) enters the market
Pay competitive wages to both groups \(w_A = w_B = P F_L(L)\)
Therefore,
discriminating firms hire \(A\) workers at \(w_A\)
non-discriminating firms hire everyone at \(w_A = w_B = w\)
Taste discrimination cannot persist under perfect competition
Taste discrimination
Imperfect competition
Monopsonistic employer
Lower wages and lower employment of discriminated group. The disadvantages persist as long as the employer does not compete with non- (or less) discriminating employers.
Market frictions (Black 1995)
Job search costs can lead to lower wages and longer unemployment spells in discriminated group.
Existence of prejudiced employers lowers reservation wage.
Therefore, wages of discriminated workers at non-discriminating firms are also lower.
Statistical discrimination
Statistical discrimination
Overview
Unobservable characteristics or imperfect measures of productivity.
Consider two workers with identical unobserved productivity \(F_A(\cdot) = F_B(\cdot)\) belonging to different groups \(A\) and \(B\).
The workers may give signals, such as education, past performance, etc. These are noisy measures of true productivities.
Employers may use average group characteristics to infer quality of signal and update their beliefs about workers.
The statistical discrimination may also change education decisions of groups and lead to persistent inequality among groups.
Statistical discrimination
Environment
Two types of workers: high \(h^+ > 0\) and low \(h^- = 0\)
Employers use costless test to get more information about workers:
- \(\Pr(\text{pass} | h^+) = 1\)
- \(\Pr(\text{pass} | h^-) = p\) where \(p \in [0, 1]\)
Employers know the overall share of efficient workers \(\pi(h^+) \equiv \pi\).
\[ \Pr\left(h = h^+ | \text{pass}\right) = \frac{\Pr\left(h = h^+ \text{ and pass}\right)}{\Pr\left(\text{pass}\right)} = \frac{\pi}{\pi + p\left(1 - \pi\right)} \]
Statistical discrimination
Self-fulfilling prophecies
Workers choose education to \(\max_e U(w, e) = \max_e w - e\)
If \(e = 1 \Rightarrow\) worker achieves productivity \(h^+\); otherwise, \(h^-\):
\[ \begin{align} \mathbb{E}\left(w^+\right) &= h^+ \frac{\pi}{\pi + p(1 - \pi)} \\ \mathbb{E}\left(w^-\right) &= pw^+ \end{align} \]
In equilibrium, \(\pi\) is equal to share of workers investing into education.
Statistical discrimination
Self-fulfilling prophecies
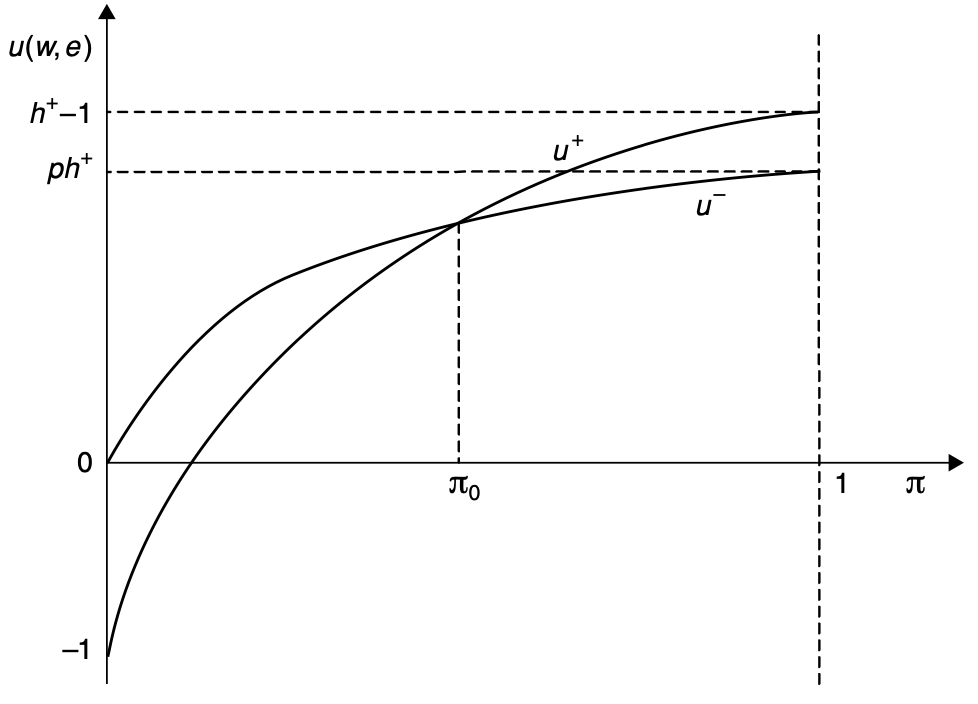
Worker invests into education iff
\[ w^+ - 1 \geq pw^+ \quad \Rightarrow \quad \pi \geq \frac{p}{\left(h^+ - 1\right)\left(1 - p\right)} \]
Workers invest into education if employers belief \(\pi\) is sufficiently high.
Statistical discrimination
Multliple equilibria and persistent inequalities
Source: Figure 8.11 in Cahuc (2004)
Empirical results
Measuring discrimination
\(\Delta\) Wage by non-productive characteristics given same productivity.
Empirical challenges
What constitutes a productive vs non-productive characteristic?
Is \(\Delta\) wage attributable to discrimination alone or worker preferences?
Does the discrimination arise from tastes or unobserved information?
Types of studies
Observational
Audit and correspondence studies
Lab experiments
Field experiments
Quasi-random experiments
Kitagawa-Oaxaca-Blinder1 decomposition
Wages in two groups (\(A\) and \(B\)) can be written
\[ \begin{align} \ln w_A &= \mathbf{x}_A \boldsymbol{\beta}_A + \varepsilon_A, \quad \mathbb{E}\left(\varepsilon_A\right) = 0 \\ \ln w_B &= \mathbf{x}_B \boldsymbol{\beta}_B + \varepsilon_B, \quad \mathbb{E}\left(\varepsilon_B\right) = 0 \\ \end{align} \]
Then, average wage differential
\[ \Delta = \mathbb{E}\left(\ln w_A\right) - \mathbb{E}\left(\ln w_B\right) = \color{#288393}{\left[\mathbb{E}\left(\mathbf{x}_A\right) - \mathbb{E}\left(\mathbf{x}_B\right)\right]\boldsymbol{\beta}_A} + \color{#9a2515}{\mathbb{E}\left(\mathbf{x}_B\right)\left(\boldsymbol{\beta}_A - \boldsymbol{\beta}_B\right)} \]
decomposed into explained and unexplained components.
Kitagawa-Oaxaca-Blinder decomposition
Interpretation
- Common support: \(\mathbf{x}_A\) and \(\mathbf{x}_B\) contain same set of variables
- Conditional mean independence: \(\mathbb{E}(\varepsilon_A) = \mathbb{E}(\varepsilon_B) = 0\)
- Invariance of conditional distributions: distribution of \(\mathbf{x}_B\) remains unchanged if \(B\) workers receive returns \(\boldsymbol{\beta}_A\)
These are very strict assumptions, so the decomposition is a correlational (not causal) measure.
Kitagawa-Oaxaca-Blinder decomposition

Source: Table 8.5 in Cahuc (2004)
Kitagawa-Oaxaca-Blinder decomposition over time
Blau and Kahn (1997): swimming upstream
\[ \begin{align}\Delta_t - \Delta_s &= \left(\Delta X_t - \Delta X_s\right) \beta_{At} + \Delta X_s \left(\beta_{At} - \beta_{As}\right) + \\ &\quad + \left(\mathbb{E}x_{Bt} - \mathbb{E}x_{Bs}\right) \Delta\beta_t + \mathbb{E}x_{Bs} \left(\Delta\beta_t - \Delta\beta_s \right) \end{align} \]
Total \(\Delta_t - \Delta_s = -0.1522\) decomposed into (see Table 2)
2nd term
3rd term
4th term
Interpretation
Change in prices
Moving along distribution
Unexplained change
Contribution
0.0997
-0.1420
0.0143
Kitagawa-Oaxaca-Blinder decomposition
Summary
Unexplained differences in earnings may be large (about 10%)
They have also risen over time, so gender wage gap did not fall as much as it would have.
But the unexplained differences \(\neq\) discrimination
- Selection into labour force, occupations, unobserved preferences
- Counterfactual labour market returns can affect HC investments
Audit (correspondence) studies
Send fictitious CVs nearly identical except in group membership
Measure callback from firms or probability of getting interviews/offers
RCT \(\Rightarrow\) group differences can be interpreted as discrimination
Challenges
CVs may not convey all relevant productive characteristics
cannot disentangle taste discrimination from statistical
hard to generalize to population
focuses on mean differences, overlooks other moments
Goldin and Rouse (2000)
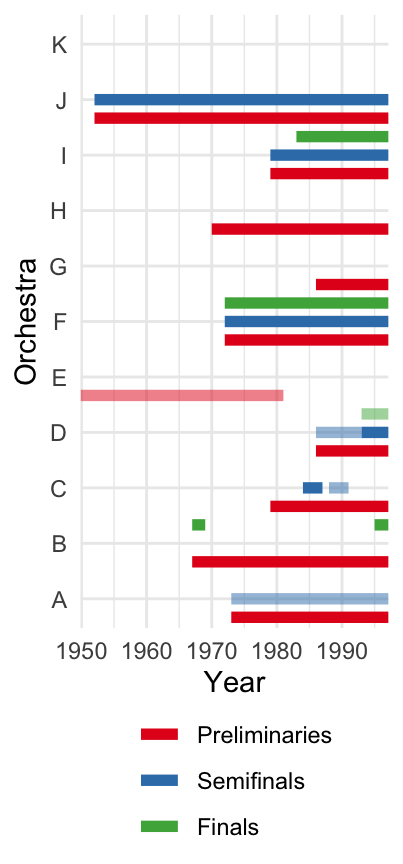
Before 1970s, musicians in orchestras were handpicked by the director
In 1970s-80s:
- auditions became more “open and routinized”
- musicians were hidden behind screen at some stage of audition
Staggered adoption of screen: difference-in-differences method
Goldin and Rouse (2000)
Difference-in-differences approach
\[ P_{ijtr} = \alpha + \beta F_i + \gamma B_{jtr} + \color{#9a2515}{\boldsymbol{\delta}} F_i \times B_{jtr} + X_{it}\theta_1 + Z_{jtr}\theta_2 + \varepsilon_{ijtr} \]
\(F_i\) - gender
\(B_{jtr}\) - indicator if screen is used
\(X_{it}\) - other individual characteristics
\(Z_{jtr}\) - other orchestral characteristics
Goldin and Rouse (2000)
Results
|
Preliminaries
|
||||
|---|---|---|---|---|
| Without semifinals | With semifinals | Semifinals | Finals | |
| Female x Blind | 0.111 | −0.025 | −0.235 | 0.331 |
| (0.067) | (0.251) | (0.133) | (0.181) | |
| Obs. | 5,395 | 6,239 | 1,360 | 1,127 |
| R2 | 0.775 | 0.697 | 0.794 | 0.878 |
Source: Table 6
Bertrand and Mullainathan (2004)
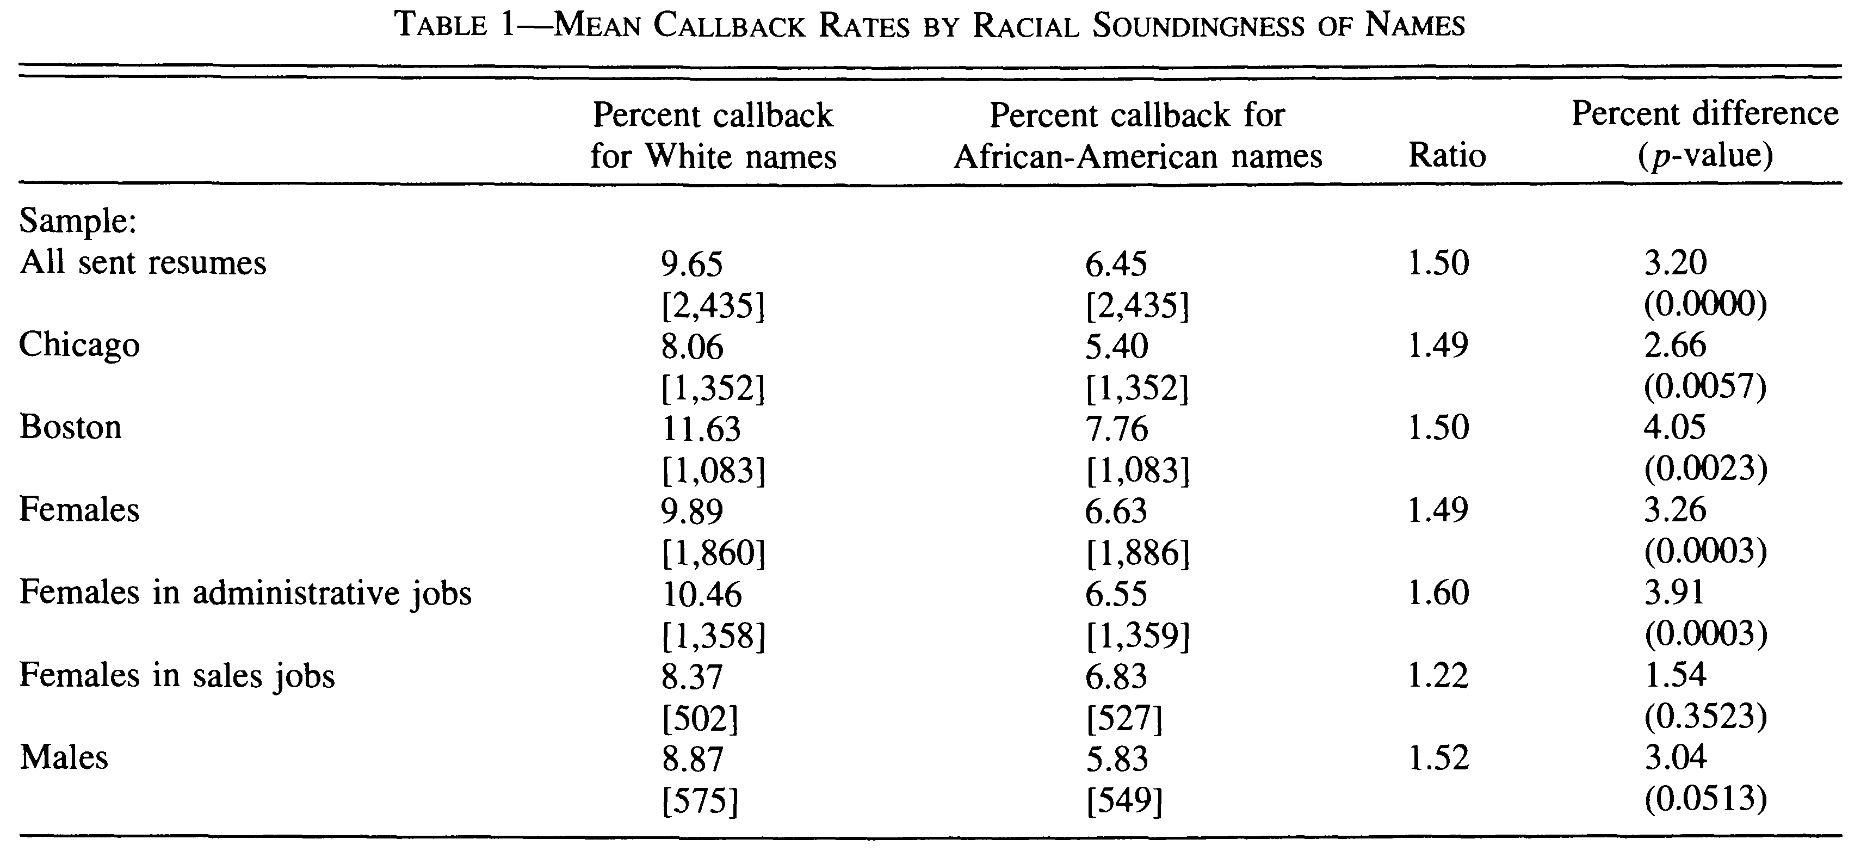
Created templates for CVs of jobseekers in Boston and Chicago
high and low quality types based on experience, skills, career profiles
randomly assign distinctively White or African-American name
track callback/email rates in race/sex/city/quality cell
| College degree | Years of experience | Volunteering experience? | Military experience? | E-mail address? | Employment holes? | Work in school? | Honors? | Computer skills? | Special skills? | |
|---|---|---|---|---|---|---|---|---|---|---|
| White names | 0.720 | 7.860 | 0.410 | 0.090 | 0.480 | 0.450 | 0.560 | 0.050 | 0.810 | 0.330 |
| (0.450) | (5.070) | (0.490) | (0.290) | (0.500) | (0.500) | (0.500) | (0.230) | (0.390) | (0.470) | |
| African-American | 0.720 | 7.830 | 0.410 | 0.100 | 0.480 | 0.450 | 0.560 | 0.050 | 0.830 | 0.330 |
| (0.450) | (5.010) | (0.490) | (0.300) | (0.500) | (0.500) | (0.500) | (0.220) | (0.370) | (0.470) |
Source: Table 3
Bertrand and Mullainathan (2004)
Mobius and Rosenblat (2006)
Lab experiment to measure taste discrimination based on beauty
Participants randomly assigned as workers (5) and employers (5).
Workers answer survey and solve simplest maze game
Survey + practice time = digital CV
Workers predict # mazes solved in 15 min (private)
\(100 A_j - 40 |C_j - A_j|\), where \(A_j\) actual and \(C_j\) predicted performance
Measures confidence
Mobius and Rosenblat (2006)
Workers randomly matched to employers (\(5\times5\))
B CV only (baseline) V CV + (visual) O CV + (oral) VO CV + + (visual and oral) FTF CV + + (face-to-face) Employers randomly told if their wage (next) adds to worker payoff
Captures taste-based discrimination
Employers set wages \(w_{ij}\) = # mazes could solve in 15 min
\(\Pi_i = 4000 - 40 \sum_{j=1}^5 |w_{ij} - A_j|\)
Mobius and Rosenblat (2006)
Workers complete 15 min “employment”
The actual \(A_j\)s are realized.
Payoffs
Firms receive \(\Pi_i\) as on previous slide
Workers receive \(\Pi_j = 100 A_j - 40 |C_j - A_j| + \sum_{i=1}^5W_{ij}\) where \[W_{ij} = \begin{cases}100w_{ij} & \text{with probability }80\%\\\bar{w} & \text{with probability } 20\%\end{cases}\]
Mobius and Rosenblat (2006)
Results
Beauty does not affect actual performance, but increases confidence
There are beauty premia, but no evidence of taste-based discrimination
B V O VO FTF BEAUTY 0.017 0.131** 0.129** 0.124** 0.167** (0.040) (0.042) (0.034) (0.036) (0.043) SETWAGE −0.010 −0.072 0.098* −0.046 0.033 (0.055) (0.052) (0.046) (0.048) (0.057) SETWAGE x BEAUTY −0.058 −0.099+ 0.005 −0.022 −0.044 (0.057) (0.053) (0.048) (0.050) (0.058) N 163 161 163 162 163 Source: Table 4
15-20% of beauty premium due to confidence, 40% due to stereotype
Rao (2019)
Field and lab experiments eliciting taste-based discrimination
Policy change in India: elite schools required to offer free places to poor students. Staggered implementation \(\Rightarrow\) diff-in-diff estimation
Results
- exposure to poor classmates makes students more prosocial
- it also reduces discrimination (teammate choices in race)
- when stakes (prizes) are high, only 6% choose slower rich student over faster poor student
- when stakes are low, 33% discriminate against poor students
- past exposure \(\downarrow\) taste discrimination WTP by 12pp
Doleac and Hansen (2020)
Quasi-random policy experiment measuring statistical discrimination
Ban-the-box (BTB) policy
- Banning prior criminal convictions box on job applications
- Hawaii in 1998 \(\longrightarrow\) 34 states + DC in 2015
BTB “does nothing to address the average job readiness of ex-offenders”.
Therefore, statistical discrimination may \(\uparrow\)
Use diff-in-diff to measure effect of BTB on employment of minorities
Doleac and Hansen (2020)
Results
| Full sample | BTB-adopting | |
|---|---|---|
| White x BTB | −0.003 | −0.005 |
| (0.006) | (0.008) | |
| Black x BTB | −0.034** | −0.031** |
| (0.015) | (0.014) | |
| Hispanic x BTB | −0.023* | −0.020 |
| (0.013) | (0.015) | |
| Obs. | 503,419 | 231,933 |
| Pre-BTB baseline | ||
| White | 0.8219 | 0.8219 |
| Black | 0.677 | 0.677 |
| Hispanic | 0.7994 | 0.7994 |
Source: Table 4
Glover, Pallais, and Pariente (2017)
Capturing self-fulfilling prophecy of statistical discrimination
Quasi-random assignment of new cashiers to managers in French stores
Do minority cashiers perform worse with biased managers?
Measure manager bias using Implicit Association Test (IAT)
- 66% moderate to severe bias
- 20% slight bias
Outcomes: absences, time worked, scanning speed, time between customers
Glover, Pallais, and Pariente (2017)
Results
| Absences | Overtime (min) | Scan per min | Inter-customer time (sec) | |
|---|---|---|---|---|
| Minority x Mngr bias | 0.012*** | −3.237* | −0.249** | 1.360** |
| (0.004) | (1.678) | (0.111) | (0.665) | |
| Obs. | 4,371 | 4,163 | 3,601 | 3,287 |
| Dep var mean | 0.0162 | -0.068 | 18.53 | 28.7 |
Sources: Tables III and IV
Doleac and Stein (2013)
Customer discrimination
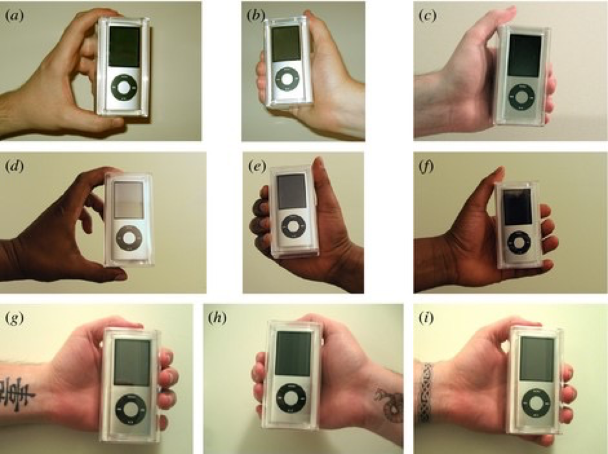
Post ads selling iPods on 300 geographically local online markets
Black sellers get:
18% fewer offers
$5.72 (11%) lower avg offer
$7.07 (12%) lower best offer
Similar (sometimes larger) effect for tattooed
Summary
Two main frameworks with different implications for labour markets
- Taste-based discrimination
- Statistical discrimination
Simple decomposition to measure unexplained gap and its changes over time
Vast experimental and quasi-experimental literature
Next: Intergenerational mobility